“Measurement is the first step that leads to control and eventually to improvement. If you can’t measure something, you can’t understand it. If you can’t understand it, you can’t control it. If you can’t control it, you can’t improve it.”
H. James Harrington
Since the agricultural revolution more than 10,000 years ago humans have increasingly sought ways to manage and improve our local and global environments. In the modern world we have become increasingly dependent on the ability to control or at the very least understand, for purposes of commerce, safety and security, and science, our environment and our impact/interaction with it. This includes a desire for increased understanding of natural and man-made or influenced phenomena such as forest fires, lightning, atmospheric constituents (clouds and aerosols), weather (storms), ocean temperatures/currents, forests and deforestation, crops/surface cover and albedo, sea-ice, and oil spills. An improved ability to manage or understand these phenomena is critical to ensuring that we maintain a healthy planet capable of sustaining humanity as part of its diverse bio-mass. But understanding these phenomena and how they are changing over time requires measurement.
Perspective
The view from outside often provides unique insights into an environment as it can be extraordinarily difficult to objectively observe a system from within. Once the ability to “slip the surly bonds of earth” 1 was established in the 1960’s it quickly became a race for government sponsored space agencies to exploit the ability to observe our earth from above by deploying satellites with capabilities for earth observation (EO). From the first space-based multispectral imager (MSI), Landsat-1, launched by NASA in 1972, to the ESA’s Sentinel-2B “Europe’s eyes on earth” launched in 2017 table 1 illustrates just a few examples of the different optical EO instruments deployed to date by governmental space agencies.
| NASA | Landsat-1 | 4 band (Green, Red, two NIR) | 1972 |
| JPSS; VIIRS (Visible IR Imaging Radiometer Suite) | 22 bands (412nm-12um); 1 PAN, 9 VIS/NIR, 8 MWIR, 4 LWIR | 2011 | |
| GOES-16; ABI (Advanced Baseline Imager) | 16 bands (2 VIS; 4 NIR; 10 IR) | 2016 | |
| GOES-16; GLM (Geostationary Lightning Mapper) | single NIR band imaging 777.4nm | 2016 | |
| ESA | ERS-1; IRR (Infrared Radiometer) | 4 band MSI VIS-SWIR (650-1.6nm) | 1991 |
| Proba-V (vegetation) | 4 bands (Blue, Red, NIR, MWIR) | 2013 | |
| Copernicus – Sentinel-2B | VIS/SWIR MSI 443-2190nm | 2017 | |
| ISRO | Rohini RS-D2 | VIS/IR imaging | 1983 |
| Oceansat(IRS-P4); OCM (Ocean Colour Monitor) | 8 band MSI VIS-IR | 1999 | |
| RESOURCESAT-2A | 4 band (3 VIS; NIR/SWIR) | 2016 |
Massive reduction in launch costs, from many tens of thousands of dollars per kilogram in the 70’s to a few thousand dollars today, due in large part to the access to “ride-share” launches combining dozens of satellites from different organizations, has made space commercially accessible and financially viable. Combined with increasing observational capabilities to provide actionable (and saleable) EO information to terrestrial customers, an EO “space-race” has emerged with a constellation of different commercial organizations acquiring EO information spanning different ranges of the electromagnetic spectrum as shown in the info-graphic below (courtesy of TerraWatch Space by Aravind).

However, observation from orbit has presented its own set of challengesand associated solutions:
- CHALLENGE: see through the atmosphere (clouds/aerosols) or in some cases observe only these atmospheric constituents or phenomena
- SOLUTION: wavelength selective imaging
- CHALLENGE: observe small signals in a large background scene
- SOLUTION: large, highly uniform collection optics
- CHALLENGE: pack as much measurement capability into as small and lightweight a package as possible to reduce launch costs
- SOLUTION: compact/multi-spectral imaging
- CHALLENGE: determine the type of phenomena (“what”) and location (“where”) under observation from a distance (eg. low earth orbit is 160-2000 km above the earth’s surface)
- SOLUTION: combination of high spatial (“where”) and spectral (“what”) resolution
- CHALLENGE: survive launch conditions and operate outside of earth’s protective atmospheric blanket
- SOLUTION: robust and reliable optical components
Optical filters of different designs and formats are a key contributor to each of these solutions within photonics based EO instruments, serving as “the eyes of the instruments”.
Wavelength Selective Imaging
Whether one utilizes band-pass (BPF), notch, or edge-pass designs, by their nature optical filters provide wavelength selectivity to the instruments in which they are employed. In EO systems, single selective wavelength bands are often necessary to allow observation of unique spectral characteristics representative of specific phenomena of interest. Different atmospheric and environmental constituents have different wavelength bands that are reflected, transmitted, or absorbed dependent on their chemical composition. The table 2. below shows the optical bands on NASA’s Landsat 8 and how they relate to the constituents being measured.
| Band # | Wavelength range (nm) | Spatial Resolution (m) | Constituent Measured |
|---|---|---|---|
| 1 | 433-453 | 30 | Coastal (shallow water)/aerosol (fine dust/smoke) |
| 2 | 450-515 | 30 | Visible (blue) |
| 3 | 525-600 | 30 | Visible (green) |
| 4 | 630-680 | 30 | Visible (red) |
| 5 | 845-855 | 30 | NIR – vegetation |
| 6 | 1556-1660 | 30 | Geology – Earth, soils and rocks |
| 7 | 2100-2300 | 30 | Geology – Earth, soils and rocks |
| 8 | 500-680 | 15 | PAN |
| 9 | 1360-1390 | 30 | Clouds |
Table 2. Landsat 8 optical bands [Ref NASA]
ESA’s SENTINEL-2 sensor bands (S2A bands shown in table 3.) have similarities to some of the Landsat bands and have become the de facto standard for both space agency and commercial visible-to-near-infrared (VNIR) EO spectral bands to explore terrestrial constituents in agriculture, forestry, and land/water features.
| Band # | Center Wavelength /Bandwidth (nm) | Spatial Resolution (m) |
|---|---|---|
| 1 | 442.7/20 | 60 |
| 2 | 492.7/65 | 10 |
| 3 | 559.8/35 | 10 |
| 4 | 664.6/30 | 10 |
| 5 | 704.1/14 | 20 |
| 6 | 740.5/14 | 20 |
| 7 | 782.8/19 | 20 |
| 8 | 832.8/105 | 10 |
| 8a | 864.7/21 | 20 |
By selecting optical filters with a band-pass region corresponding to the wavelength band of interest the user can then selectively observe only the signal from the constituent or phenomena under study gaining “more signal with less background” in their data.
Large, Highly Uniform Collection Optics
If the constituent of interest has spectral bands that are very narrow or are in close spectral proximity to “background” bands or if the signal is a small contributor compared to the background, then large, narrow band-pass filters (NBPFs) providing enhanced wavelength selectivity may be required.
Measuring or mapping lightning from orbit is an example of an application demanding high wavelength selectivity over a large field of view. Lightning can be studied by observing a narrow atomic oxygen triplet line at 777.4nm (reference MeteoSAT LI). However, as it uncertain as to where and when a lightning strike may occur a large detector area is needed over which this very narrow wavelength selectivity is maintained. This requires an extremely uniform, narrow optical filter. Iridian has demonstrated the capability to produce such a NBPF centered to within 20pm of the target wavelength over an operating clear aperture >125mm in diameter3.
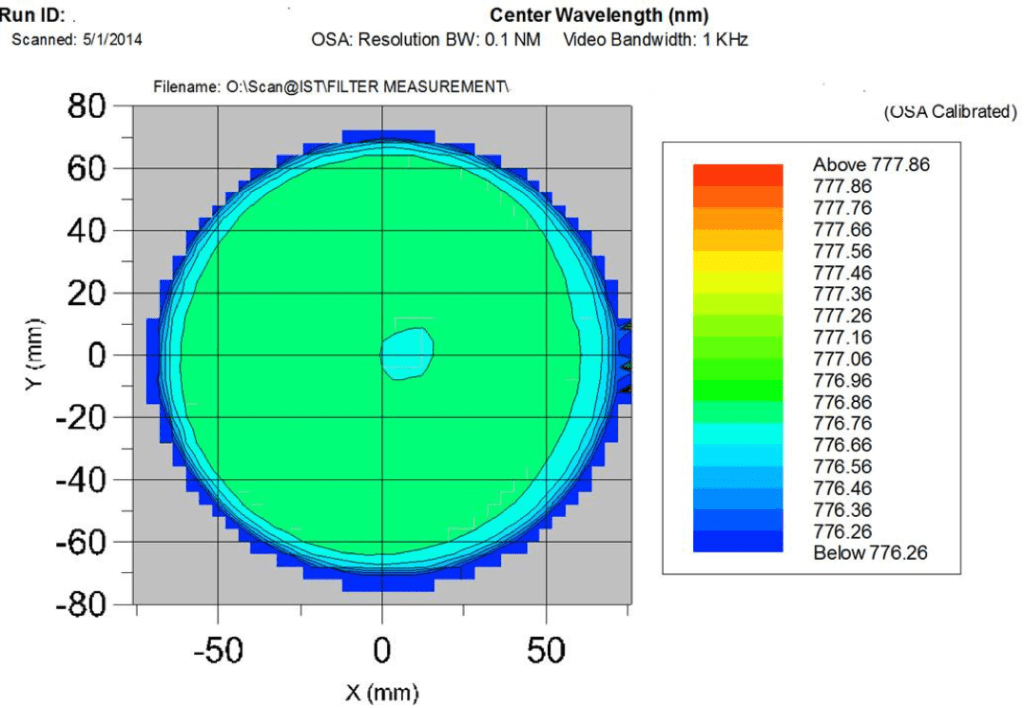
Figure 1.Spatial variation in CWL across 125mm diameter demonstrating highly uniform large NBPF
The advantage of an instrument with this precision and “field of view” must be traded off against the increased weight and cost to produce such large complex filters and the optical components used in conjunction with them.
Compact/Multi-spectral Imaging
To minimize the weight and cost per “science line” many EO imaging systems try to pack as much science into one instrument as possible by using a single detector to interrogate multiple spectral bands of interest.This multi-spectral imaging (MSI) has driven the need for filter arrays in which the spectral performance varies spatially across the part.
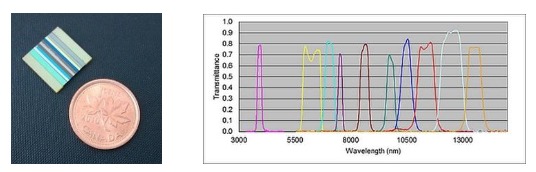
Figure 2. Multi-spectral array of 10 BPFs (developed under a subcontract from ABB Canada for the Space Technology Development Program of the Canadian Space Agency)
By using a filter with this multi-zone type of construction, different pixel bands on the detector will be sensitive to different spectral bands and therefore can interrogate different constituents or phenomena of interest.
Manufacture of multi-zone/multi-spectral filter (MZF or MSF) arrays can be achieved either via a butcher block construction, in which different filters are manufactured, singulated, and then assembled together into an array, or by patterning (via masking) different spectral bands on a monolithic substrate. Hybrid approaches are also possible combining assembly and patterning together on a single filter array.
Butcher block MZF arrays provide the advantage of simplifying the coating process by avoidance of compounding coating run yields; the filter manufacturer only coats a single band on any given substrate which is the approach used for most “standard” optical filter manufacturing. Butcher block arrays can be a good choice when many (>4 or 5) bands of interest are to be studied or when the complexity of individual filter bands is high, driving increased filter coating thickness and decreased run success yields.
Patterned MZF arrays provide the possibility to create nearly any size or shape of spectral band (they don’t need to be stripes or rectangles as in a butcher block) with substantial improvement (2x or more) in the size of the transition zone. Pixels under the transition zone are unusable for analysis so reducing the loss of good pixels by using a patterned array can be advantageous. Additionally, coating on monolithic substrates avoids challenges associated with alignment tolerances between the different spectral bands.
High Spatial and Spectral Resolution
Greater discrimination of a “science line” can be enhanced by reducing the bandwidth of the filter associated with the band of interest. In MSI applications, this improvement in spectral resolution comes at the cost of reduced spatial resolution as this effectively shrinks the signal to noise (less total light) and the aperture size (pixels available) for any one band. In contrast if a broad band, panchromatic (PAN) filter spanning the entire visible spectrum is used then the increase in total light at these pixels provides improved spatial resolution. For Landsat 8 the PAN band has twice the spatial resolution (15m versus 30m) compared to the other optical bands (see Table 2). By combining PAN along with wavelength selective bands, through “PAN sharpening” an array can be used both to accurately map where specific signal is originating and what the signal represents.
Robust and Reliable Optics
Finally, there is no value in having a system with a high-resolution optical filter if it doesn’t survive use in orbit. With careful control of deposition processes (sputtering or enhanced evaporating) and materials, experienced manufacturers can produce optical filters with good density and adhesion to withstand typical terrestrial requirements for variations in temperature and humidity without changing or degrading with use or over time.
Typical reliability specs include:
- No change in spectral performance or degradation in surface quality after
- 24 hours of damp heat exposure (95%RH; 49 °C)).
- Thermal cycling/shock tests from -60 to 70 °C
- Tape and rub tests for adhesion
Once in orbit these filters and filter arrays may also need to withstand extreme temperature ranges (down to 70 K) and the solar and electron radiation that is normally filtered out by our atmosphere. Filters and filter arrays used in these environments may require additional specialized testing to verify that they will survive in this harsh environment.
Challenges for the Future
As launch costs continue to decline the commercialization of space is proliferating. While NASA, ESA, and ISRO continue to plan and to launch satellites with EO capabilities, we can expect that constellations of EO satellites will be owned and operated increasingly by private organizations such as Planet, EarthDaily Analytics, Satellogic, GHGSat, among many others, rather than governmental space agencies. According to a recent EuroConsult report4, between 2011-2020 commercial satellite constellations accounted for 65% of all EO satellite launches – that share of commercial EO satellites is expected to grow to >75% over the next decade with an estimate of more than 2600 EO satellites to be launched between 2020 and 2030.
This capitalism of space continues to make more information available than ever before and this data will be used for more than just the historical defense and intelligence “big brother” purposes. As the flow of extra-terrestrially gathered data opens up, new applications emerge to leverage this information to better manage and control terrestrial activities and commerce. Photonics and optical filters are poised to play a key role in enabling many of these new developments.
- [Ref. John Gillespie Magee, Jr.]
- [Ref NASA,ESA,ISRO,JAXA]
- Large format BPF – a uniformity challenge (Iridian)
- https://news.satnews.com/2022/01/12/euroconsult-publishes-the-14th-edition-of-their-earth-observation-satellite-systems-market-report-analysis/